



Reports
Original analyses of US public K-12 schools, drawn from NCES, the American Community Survey, and state assessment programs. Data, methodology, and downloadable CSVs are provided so anyone can verify or extend the findings.
Enrollment trends by state
For each US state, the 50 brick-and-mortar public schools with the largest enrollment shift between 2017-18 and 2024-25. Virtual academies excluded.
Lincoln, Washington, and Central: the names that repeat hundreds of times across the US public school map.
21,890 schools compared with themselves 34 years apart: same federal ID, same grades, 1990-91 and 2024-25.
Public school enrollment in grades 1 through 3 compared with grades 6 through 8, for every state and Washington, D.C., in the 2024-25 school year.
A diversity index for all 50 states and DC, calculated twice: once on every public school student in the state pooled together, and once on the school an average student actually attends.
Enrollment fell 5.2 percent across 43 states between 2017-18 and 2024-25 while reported teacher counts rose 1.7 percent. Only North Carolina and Alaska ended the period with more crowded classrooms.
A demographically-adjusted, state-by-state comparison of charter and district school performance.

Where students are stronger in math than reading, and where it's the reverse, in every state and school.
Schools where state-test proficiency rose by 20+ percentage points in five years.

Where teachers serve the fewest students, and what those schools have in common.

County-by-county ranking on a composite of test scores, student-teacher ratio, and growth trajectory.

Districts where neighboring schools post test-score differences of 40+ percentage points.

Schools that appeared in the 2024-25 NCES universe but did not exist in 2017-18.

The largest district school portfolios in the country and the share of each state's schools they represent.
City-level rankings using NCES data joined to American Community Survey income and education attainment.

Where charter enrollment grew fastest and where it shrank between 2017-18 and 2024-25.

US public schools with student-teacher ratios exceeding 25:1, and the states where they cluster.

US schools where 95%+ of students qualify for free/reduced lunch.

What share of each state's K-12 students attend a school other than their assigned neighborhood school.

The states where racial composition shifted most between 2017-18 and 2024-25.

How tightly free/reduced lunch share predicts test outcomes in each US state.

Single-teacher schoolhouses, K-8s with under 25 students, and the rural districts keeping them open.

Mega high schools serving 4,000+ students, and what scale does to outcomes.

Elementary schools with 2,000+ students, and what large elementary scale means operationally.

Schools serving high-poverty populations that outperform their state averages.

Where the 811,000 US public virtual school students are, and the operators that serve them.

US public schools where 60%+ of students qualify for free/reduced lunch yet scores rank in the top quartile of their state.

Where a single racial group makes up 95%+ of students, and the geographic patterns by group.

Most-recent statewide proficiency rates for reading and math across every state's native assessment program.

Schools where enrollment surged 50%+ between 2017-18 and 2024-25, and where the growth concentrates.

Brick-and-mortar schools where each teacher serves 25+ students, and the districts where they cluster.

A head-to-head on staffing, outcomes, and trajectory by NCES locale code.

US schools where no single racial group exceeds 35% of enrollment.

Schools where 50%+ of students are English-language learners, and where they cluster.

Schools that stayed open but lost more than 50% of their enrollment between 2017-18 and 2024-25.

Schools where actual proficiency lags what their student profile would predict, ranked by gap.

A demographically-adjusted school ranking: where do schools outperform what their FRL share would predict?

Schools where teachers carry 30+ students per class and the state-law thresholds they breach.
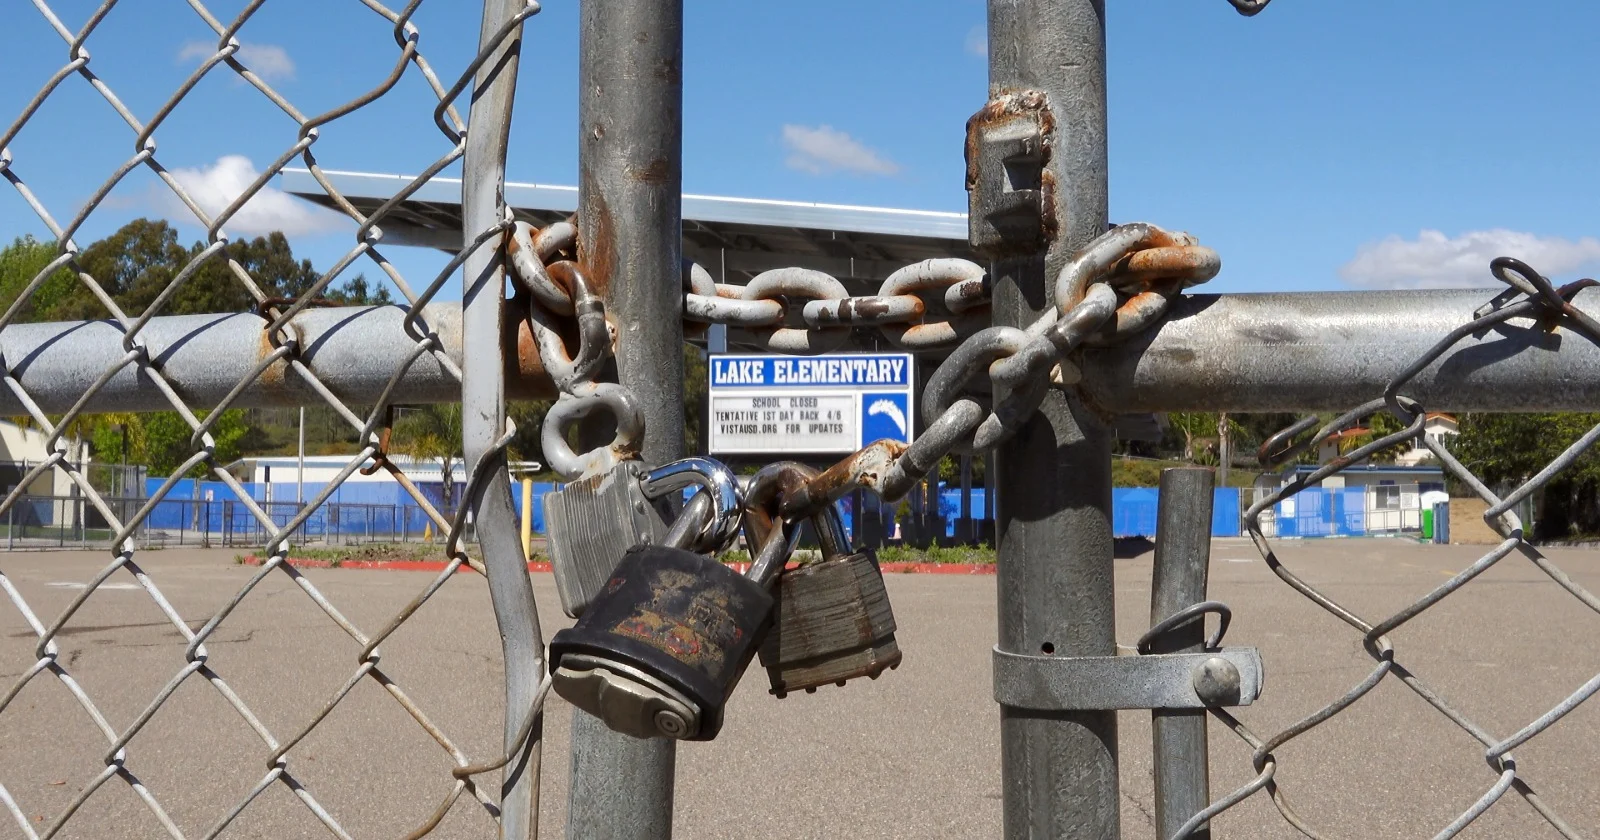
A state-by-state look at where US public K-12 schools disappeared between 2017-18 and 2024-25, and the 2 million students displaced.