



The bulletin board for America's public schools. Parents, teachers, students, and staff. One community per school.
GEOGRAPHY

The best US cities for public schools

City-level rankings using NCES data joined to American Community Survey income and education attainment.

May 25, 2026
KEY FINDING
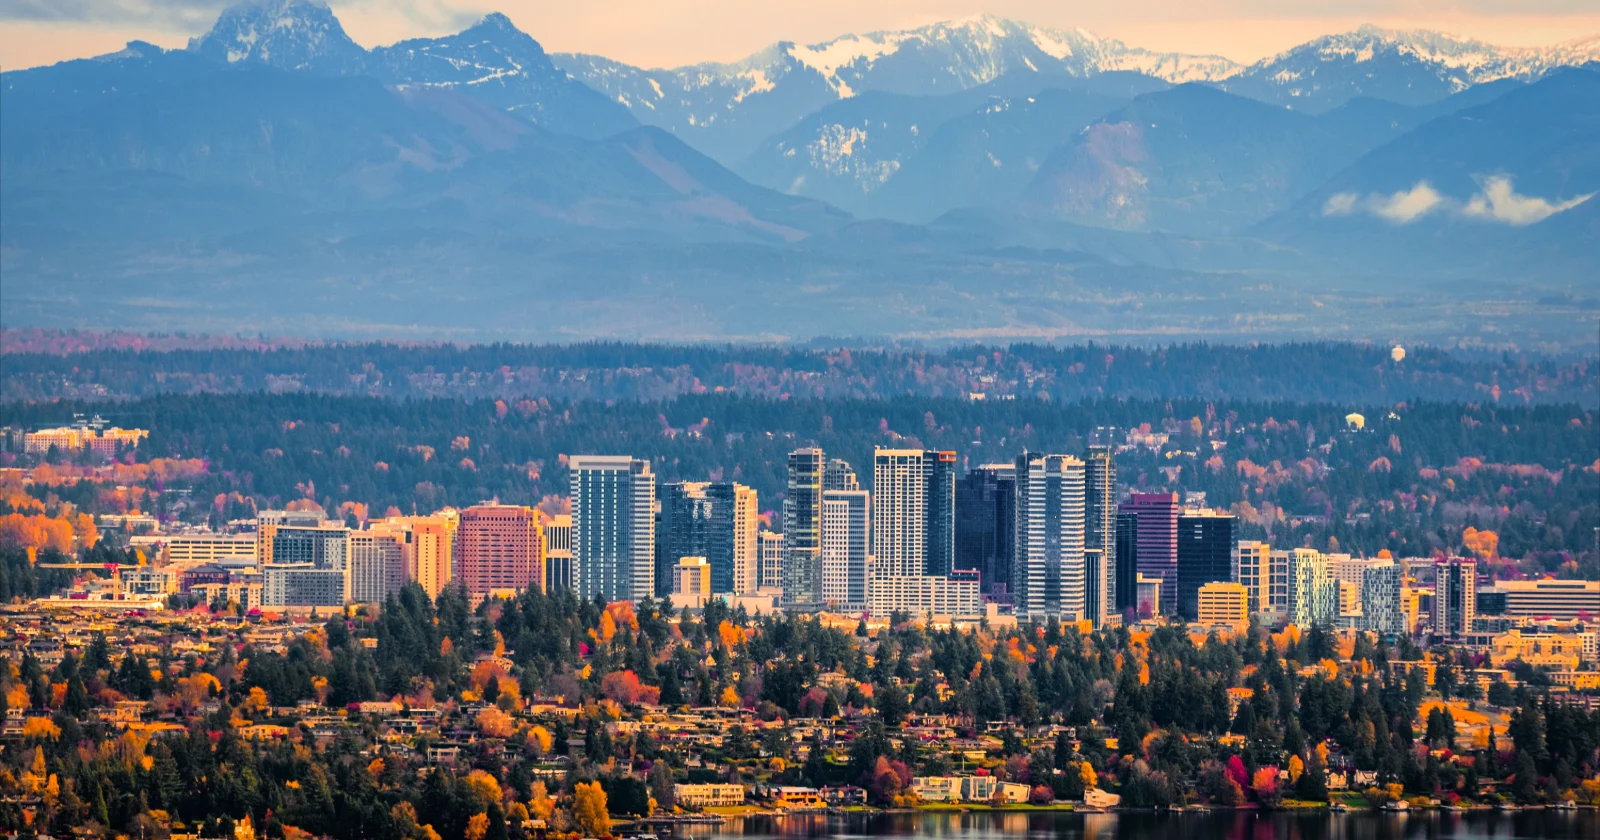
The cities that rank highest on average public school performance tend to be smaller wealthy suburbs of larger metros (Bellevue, Plano, Naperville, Newton, McLean) rather than metro core cities themselves. Bachelor's-degree share among adults is a slightly stronger predictor than median income.
Cities ranked
100
min 5 public schools per city
Largest by enrollment
HOUSTON
526,618 students
Source
NCES + ACS
TOP 100 US CITIES BY PUBLIC SCHOOL ENROLLMENT
CityStateSchoolsEnrollmentAvg ratioAvg % FRL
HOUSTONTexas775526,61816.6:182.8%
SAN ANTONIOTexas559336,69314.9:169.8%
ChicagoIllinois655328,08015.4:177.7%
BROOKLYNNew York582291,69711.7:182.1%
Los AngelesCalifornia571253,67119.0:186.9%
Las VegasNevada317251,81533.8:193.8%
DALLASTexas365208,40615.3:184.9%
BRONXNew York470203,50511.5:191.6%
PHOENIXArizona411198,17717.5:1
PhiladelphiaPennsylvania302180,83714.8:197.1%
MIAMIFlorida317176,28422.3:148.7%
San DiegoCalifornia284163,33422.0:157.4%
AUSTINTexas265158,69014.1:159.5%
IndianapolisIndiana251157,46915.5:162.4%
FORT WORTHTexas272156,09615.8:174.1%
ORLANDOFlorida207153,42016.8:147.3%
BaltimoreMaryland273152,96014.3:170.0%
EL PASOTexas219151,34115.0:176.5%
NEW YORKNew York353149,93411.3:175.3%
JACKSONVILLEFlorida203132,91318.5:153.0%
SacramentoCalifornia202132,44422.0:172.0%
CharlotteNorth Carolina182131,67516.5:177.1%
San JoseCalifornia234126,31121.5:153.4%
BakersfieldCalifornia150124,61721.2:179.6%
FresnoCalifornia185119,99119.7:180.5%
TUCSONArizona287109,06515.4:1
Oklahoma CityOklahoma146108,78116.5:179.3%
KATYTexas95106,63314.0:149.9%
MemphisTennessee228104,82321.5:1-0.3%
TAMPAFlorida175104,49718.1:151.4%
DENVERColorado228100,98514.7:167.7%
CincinnatiOhio17698,51918.6:137.5%
AtlantaGeorgia14094,75512.4:177.2%
WashingtonDistrict of Columbia24494,01911.0:1
ColumbusOhio23491,60718.6:157.9%
OMAHANebraska18891,02517.5:126.1%
COLORADO SPRINGSColorado18890,43915.2:149.3%
LouisvilleKentucky16587,69113.9:165.9%
ALBUQUERQUENew Mexico20083,09521.7:188.9%
DETROITMichigan18782,20019.9:186.6%
MilwaukeeWisconsin17975,35817.3:181.4%
MESAArizona13775,10315.6:1
PortlandOregon15374,71216.3:170.8%
AURORAColorado10674,49318.0:165.3%
StocktonCalifornia12574,36922.4:177.3%
ARLINGTONTexas10569,83114.4:171.6%
PittsburghPennsylvania14668,82612.7:167.4%
RaleighNorth Carolina10066,76413.7:156.6%
KANSAS CITYMissouri15465,50512.7:171.7%
Virginia BeachVirginia8264,73114.5:154.6%
ST LOUISMissouri16163,45113.0:171.0%
FRISCOTexas7163,34014.8:114.9%
LAREDOTexas8562,41418.3:185.6%
STATEN ISLANDNew York8762,25412.2:170.5%
ROCHESTERNew York11660,51212.2:166.7%
NashvilleTennessee13058,59022.0:1
HarrisburgPennsylvania3957,91514.9:184.5%
RichmondVirginia9557,34513.9:187.2%
RiversideCalifornia8257,00122.8:178.8%
San FranciscoCalifornia12556,50520.9:157.8%
Long BeachCalifornia7856,30124.1:164.1%
Baton RougeLouisiana10556,10333.1:175.6%
KnoxvilleTennessee8954,964
TulsaOklahoma10354,47717.6:179.2%
SAINT PAULMinnesota17654,41715.1:171.0%
WichitaKansas9953,89214.0:177.3%
CORPUS CHRISTITexas9253,54715.4:170.5%
HendersonNevada5653,41066.0:185.9%
Santa AnaCalifornia7953,30321.3:183.3%
CYPRESSTexas3753,17016.5:139.0%
MariettaGeorgia6053,13312.9:148.1%
NEWARKNew Jersey6553,05514.6:180.7%
GLENDALEArizona8952,89020.0:1
KLEINTexas5352,43714.4:158.3%
ClevelandOhio15352,02617.0:142.7%
Chula VistaCalifornia6951,15921.2:154.6%
ModestoCalifornia7650,94222.1:174.5%
BROWNSVILLETexas8050,59815.7:189.4%
AlexandriaVirginia5550,15313.8:160.1%
GRAND RAPIDSMichigan13549,92918.6:162.8%
AnaheimCalifornia7149,81523.0:170.6%
ColumbiaSouth Carolina7849,09713.2:1
GILBERTArizona7248,56218.2:1
OaklandCalifornia12248,24120.8:180.6%
New OrleansLouisiana7748,23813.7:178.7%
GreensboroNorth Carolina8148,11215.0:191.3%
San BernardinoCalifornia8347,63920.3:191.5%
SALT LAKE CITYUtah9347,40419.1:142.8%
KISSIMMEEFlorida5746,35826.9:157.5%
Fort WayneIndiana7846,33013.7:155.1%
IrvineCalifornia5246,18325.5:124.2%
BUFFALONew York8845,41910.6:181.3%
DurhamNorth Carolina7145,34114.8:195.4%
LawrencevilleGeorgia3844,74113.4:168.3%
GreenvilleSouth Carolina6044,40514.6:148.1%
PLANOTexas7444,37613.5:138.8%
GARLANDTexas6943,88715.2:179.0%
SEATTLEWashington9343,57615.6:138.1%
IRVINGTexas5843,11516.3:170.9%
LUBBOCKTexas8343,01813.9:167.5%

The headline

City-level rankings of US public schools differ meaningfully from county-level rankings. Cities concentrate both the highest and lowest performing schools within a single jurisdiction, and the average across a city's schools can mask wide internal variation.

The cities that rank highest on average public school performance tend to be smaller wealthy suburbs of larger metros (Bellevue WA, Plano TX, Naperville IL, Newton MA, McLean VA) rather than the metro core cities themselves.

The two definitions of "best"

This report ranks cities on two distinct measures:

  • Average proficiency: the mean state-assessment proficiency across all public schools in the city. Favors wealthy, homogeneous suburbs.
  • Best top-quartile share: the percentage of a city's public schools that rank in their state's top quartile on proficiency. Favors cities with strong magnet systems where some schools dramatically outperform.

The two measures produce different leaderboards. Both are published in the table below.

What the underlying numbers say

The strongest predictor of city-level average school performance is the percentage of adults in the city with a bachelor's degree or higher, slightly stronger than median household income. Cities with high educational attainment and moderate income often outperform cities with high income and lower attainment.

How parents should use city rankings

City-level rankings answer a different question than school-level rankings. A family with school-age children considering where to buy a home benefits from knowing both. How strong is the typical school in this city, and how strong is the specific school they would attend.

Methodology

City defined as the NCES-reported city of each public school, normalized to handle variants like "ST." vs "Saint". Average proficiency computed across the school's most recent state-native assessment for math + reading/ELA. Education attainment from ACS 2020-2024 5-year estimates at the place-level.

HOW TO CITE THIS REPORT

Anyone is welcome to cite or republish these findings. Please credit allk12.com and link back to this page so readers can verify the underlying data.

allk12 (2026). "The best US cities for public schools." Retrieved from https://allk12.com/reports/best-cities-public-schools
Source: <a href="https://allk12.com/reports/best-cities-public-schools">allk12.com</a>
For interview requests or custom data pulls: [email protected]
DOWNLOAD THE DATA
best-cities-public-schools.csv
DATA NOTICE

allk12 is independent and not affiliated with, endorsed by, or sponsored by NCES, the US Census Bureau, any state education agency or assessment program, or any other government agency. Source data is compiled from public records and provided "as is," without warranty of accuracy or completeness. You rely on it, and any analysis derived from it, at your own risk. See the full disclaimer.