




Allen High School in Allen, Texas, enrolled 1,445 students in the 1990-91 school year and 5,206 in 2024-25, according to an allk12 analysis of federal enrollment data. That gain of 3,761 students is the largest among the 21,890 public schools that can be compared with themselves across the 34 years.
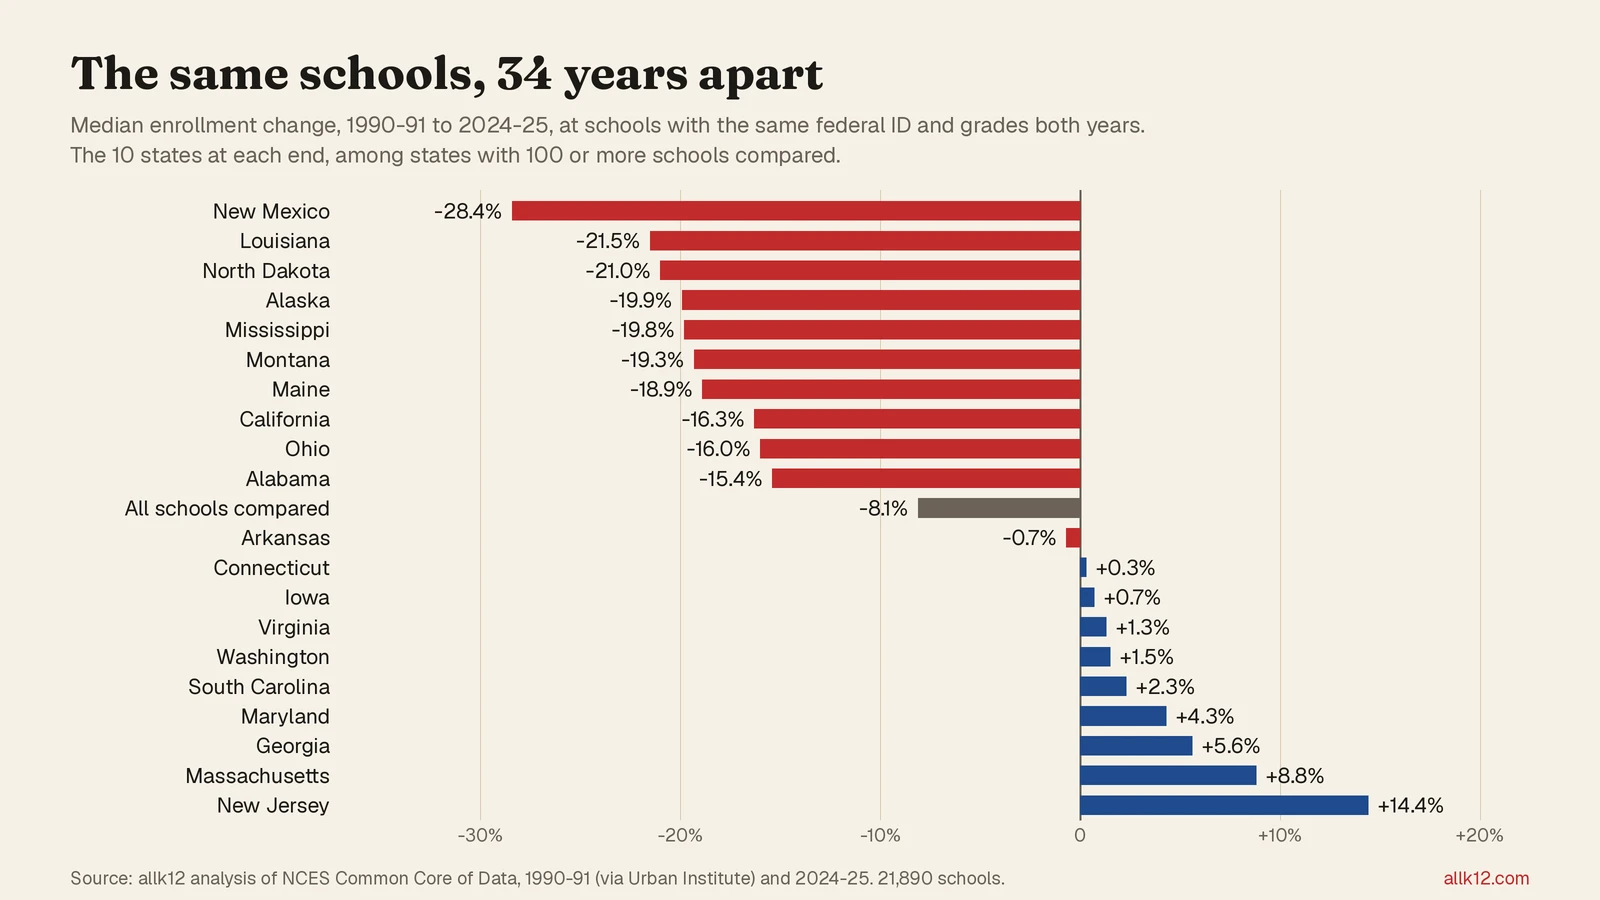
Most of those schools went the other way. The typical school shrank 8.1%. In all, 12,849 schools lost students, 8,977 gained them, and 64 ended exactly where they started. Together the 21,890 schools enrolled 14,263,688 students in 1990-91 and 13,985,922 in 2024-25, a drop of 1.9%.
The split by state is wide. In New Jersey, the typical school among the 617 compared grew 14.4%, and 65.2% of them gained students. In New Mexico, the typical school among 229 compared shrank 28.4%, and 15.7% grew.
High schools hold 99 of the 100 spots on the gain list, and Texas schools hold 37 of them. Coppell High School in Coppell went from 802 students to 4,068, and Lake Travis High School in Austin went from 448 to 3,569. Outside Texas, William Mason High School in Mason, Ohio, grew from 678 to 3,435, and Hamilton Southeastern High School in Fishers, Indiana, grew from 760 to 3,504.
By grade level, the typical high school grew and the typical elementary school shrank. Among the 7,643 high schools that served grades 9 through 12 in both years, the median school grew 2.8%. Among the 2,742 elementary schools that served kindergarten through fifth grade both years, the median school shrank 10.2%. Schools that served kindergarten through sixth grade, and pre-K through fifth grade, had a median change of -18.4% each.
Which schools lost the most?
Belmont Senior High in Los Angeles had 4,327 students in 1990-91 and 614 in 2024-25, the largest drop of any school compared. California has 43 of the 100 biggest losses, and Los Angeles and Chicago each have 13. Miami Sunset Senior High in Miami fell from 3,678 students to 979. La Sierra High in Fullerton, California, now listed as an alternative school, fell from 3,033 to 236.
A falling count does not always mean a neighborhood emptied out. The federal data records how many students a school had, not why the number moved. When a district opens a new school nearby or redraws attendance zones, an older school's count can fall even if the area around it did not shrink.
How the comparison works
The comparison leaves out most of today's public schools. Of the 101,110 schools operating in 2024-25, 58,199 carry a federal school ID that also appears in the 1990-91 directory. Schools whose grades changed between the two years are left out, so a K-5 that became a K-8, or an elementary school that added pre-K, never counts as growth. Schools that reported no students in either year are left out too. That leaves 21,890 schools, each compared only with itself.
Matching on the ID also misses some schools that did exist in 1990. A school's federal ID begins with its district's ID, and when districts merge or renumber, their schools receive new IDs. For that reason this report does not rank states by how many of their schools date to 1990, since the result would partly measure each state's renumbering history.
Enrollment for 1990-91 comes from the National Center for Education Statistics' Common Core of Data, as published by the Urban Institute's Education Data Portal. Enrollment for 2024-25 comes from the same federal collection. The state table covers every state, and the CSV download lists all 21,890 schools.