



The headline
Every state in the country is more racially and ethnically diverse than the school its average student attends. Across 90,492 public schools and 48.9 million students, the typical American student sits in a school scoring 47.6 on a 0 to 100 diversity index. Not one state matches its own statewide mix inside its school buildings.
The index is the chance that two students picked at random are from different racial or ethnic groups. Pick two students out of a whole state and the odds are one number. In all 51 places, the odds inside a single school come out lower, because students are not distributed across schools the way they are distributed across the state.
How the two numbers work
Both columns in the table above use the same formula on the same federal enrollment counts. Only the unit changes.
The statewide index pools every public school student in the state into one group and runs the calculation once. A state split evenly between two groups scores 50: one minus (0.5 x 0.5 + 0.5 x 0.5) is 0.50. A state that is 90 percent one group and 10 percent another scores 18: one minus (0.81 + 0.01) is 0.18.
The typical-school index runs the same formula separately on each school, then averages the results weighted by enrollment. Weighting by enrollment is what makes it "typical": a 3,000-student high school counts 30 times as much as a 100-student elementary school, so the number describes the school an average student actually walks into.
If every school mirrored its state, the two columns would be identical and every gap would be zero. The gap column is the share of a state's diversity that exists on paper but not in the building.
Where the gap is widest
Illinois has the widest gap in the country at 24.1 points. Statewide it scores 68.8, which ranks 13th. Inside the average Illinois school the number falls to 44.6, which ranks 27th. Illinois public schools serve 1.84 million students across 3,793 schools, and the state's largest single group, White students, is 44.6 percent of enrollment.
New York is second at 23.4 points, and the rank shift there is sharper. New York is the 4th most diverse state on the pooled measure at 71.8. On the typical-school measure it drops to 19th at 48.4.
After those two: New Jersey 19.9, Maryland 18.7, Michigan 18.7, Mississippi 18.6, Tennessee 18.5, and Georgia 18.1. Michigan is the clearest case of a mid-diversity state with heavily sorted schools. It ranks 34th statewide at 56.3 and 43rd on the typical school at 37.6.
Twenty-two of the 51 places have a gap of 15 points or more. The median gap is 14.1 points, which belongs to New Mexico.
Where schools look like the state
The five smallest gaps are Vermont at 1.5 points, West Virginia at 2.2, Maine at 3.5, New Hampshire at 3.5, and Wyoming at 5.0. All five are also among the six least diverse states in the country, so the small gap is mostly arithmetic. West Virginia scores 23.1 statewide and 20.9 in the typical school. There is not much variation available to sort.
Hawaii is the one state where high diversity survives the trip into the school building. It scores 79.3 statewide, the highest in the country, and 71.4 in the typical school, also the highest, and 9 points clear of second-place Oklahoma. Its gap is 8.0 points. No group in Hawaii is close to a majority: the largest, Pacific Islander students, is 24.9 percent of enrollment.
Delaware (9.0-point gap) and Nevada (9.4) are the other two high-diversity states with single-digit gaps. Nevada assigns students to countywide districts, and Delaware runs its whole public system on 226 schools and 142,134 students, fewer than a single large metro district in most states. This study measures the gap, it does not test what produces it, and the table has counterexamples in both directions: Maryland also has countywide districts and sits near the top of the gap column at 18.7.
The most and least diverse states
The most diverse student bodies on the pooled measure are Hawaii (79.3), Maryland (73.4), Oklahoma (72.8), New York (71.8), Virginia (71.5), and Delaware (71.3). Oklahoma places third because nothing there approaches a majority. Its largest group, White students, is 43.4 percent.
The least diverse are West Virginia (23.1), Vermont (24.5), Maine (27.7), New Hampshire (32.4), Montana (40.4), and Wyoming (40.7). In West Virginia, 87.4 percent of public school students are White.
The two largest systems land in nearly the same place. California enrolls 5.76 million students and scores 62.3 statewide, 47.5 typical. Texas enrolls 5.54 million and scores 63.4 statewide, 47.9 typical. Their largest groups are Hispanic students at 56.2 percent and 53.5 percent respectively.
What the gap does not measure
This is a race and ethnicity measure only. It says nothing about family income, home language, or disability, and a school can be racially mixed and economically uniform.
It also says nothing about quality. A high index is not a good school and a low index is not a bad one. For performance we publish a separate, poverty-adjusted measure at BeatsExpectations.
The unit is the school, not the classroom. Course placement and tracking can concentrate students further inside a building, and federal enrollment files cannot see that.
Finally, a diverse school is not evidence of policy. Some of the balanced schools on our most diverse schools list got there through military housing assignment or magnet lotteries, and others simply reflect the neighborhood around them.
Methodology
Source: NCES Common Core of Data, SY 2024-25 school-level race and ethnicity counts. Seven groups are used exactly as the federal file reports them: White, Black, Hispanic, Asian, Native American, Pacific Islander, and Two or more races.
The index is the Simpson diversity index, the same form the Census Bureau uses for its county diversity index, expressed on a 0 to 100 scale: 100 x (1 minus the sum of each group's squared share). With seven groups the arithmetic maximum is 85.7, reached only if every group holds exactly one seventh of enrollment, so no real state can score 100.
Included: schools with at least 50 students whose reported race and ethnicity counts cover at least 90 percent of total enrollment. That leaves 90,492 schools holding 48,934,345 students, out of roughly 101,110 operating public schools. Schools below the thresholds are dropped entirely rather than estimated, because a school with 60 percent of its enrollment unclassified would produce a confident-looking number built on a third of the data. Puerto Rico, Guam, the US Virgin Islands, American Samoa, and the Northern Mariana Islands are excluded.
Statewide index: all seven group counts are summed across the state's qualifying schools, then the formula runs once on those totals. Typical-school index: the formula runs on each school's own counts, and the school results are averaged with each school weighted by its enrollment.
Related surfaces on this site: most diverse schools in America, most diverse school districts, and the most segregated schools report. The full 51-row dataset behind this study downloads as CSV, and it is free to reuse with attribution.
Figures updated September 16, 2026.
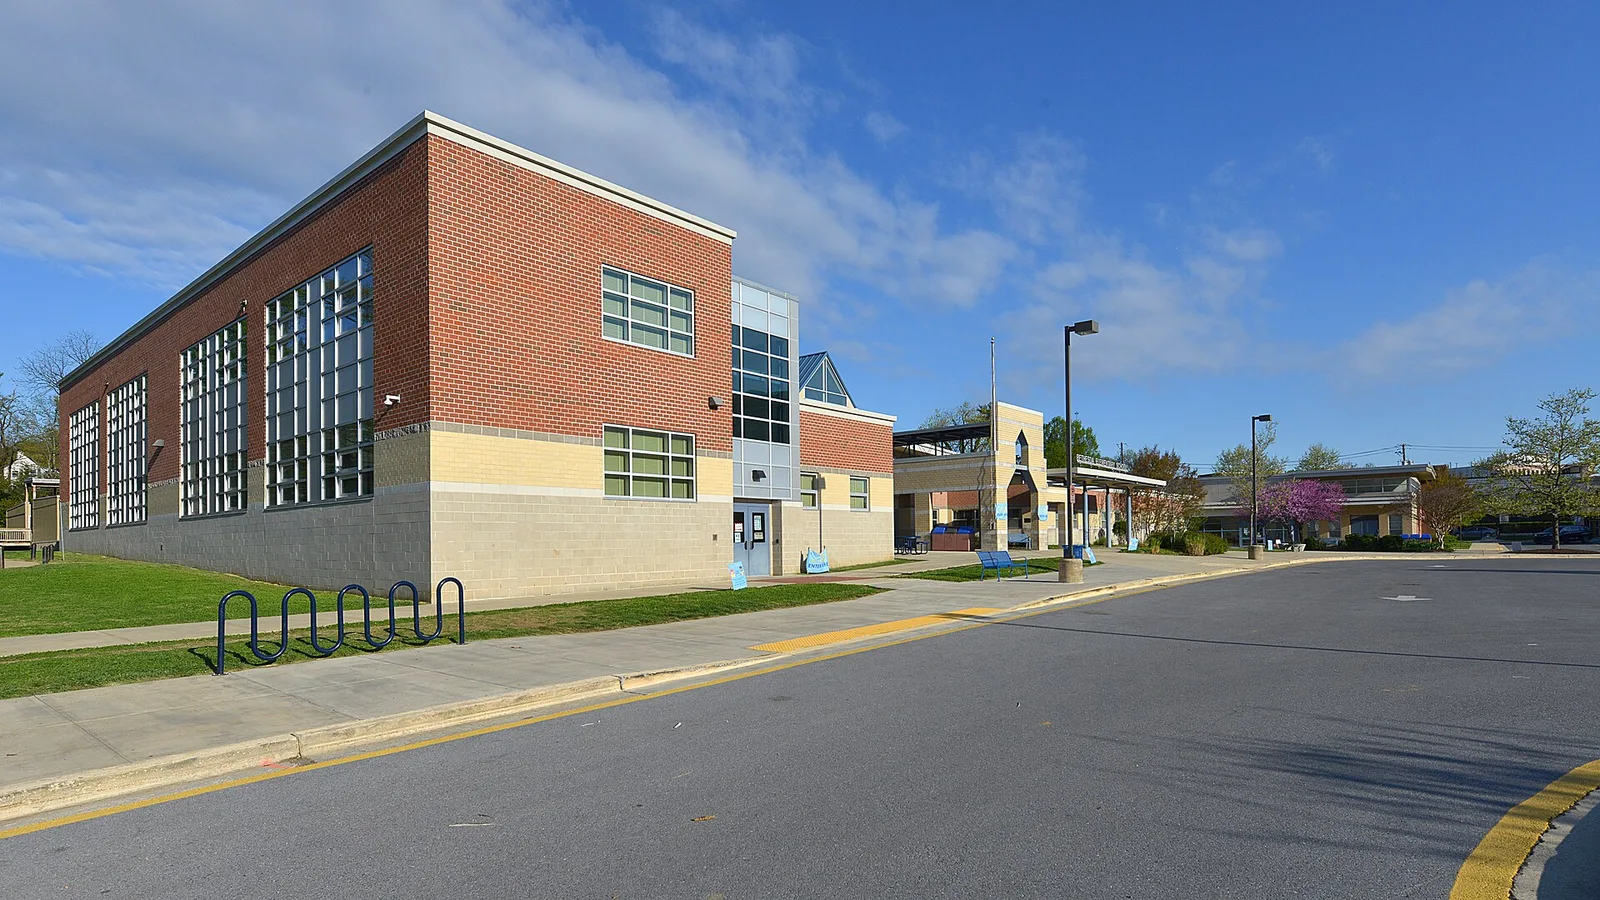
Photo: Bethesda Elementary School, Bethesda, Maryland, by G. Edward Johnson, CC BY 4.0, via Wikimedia Commons.