
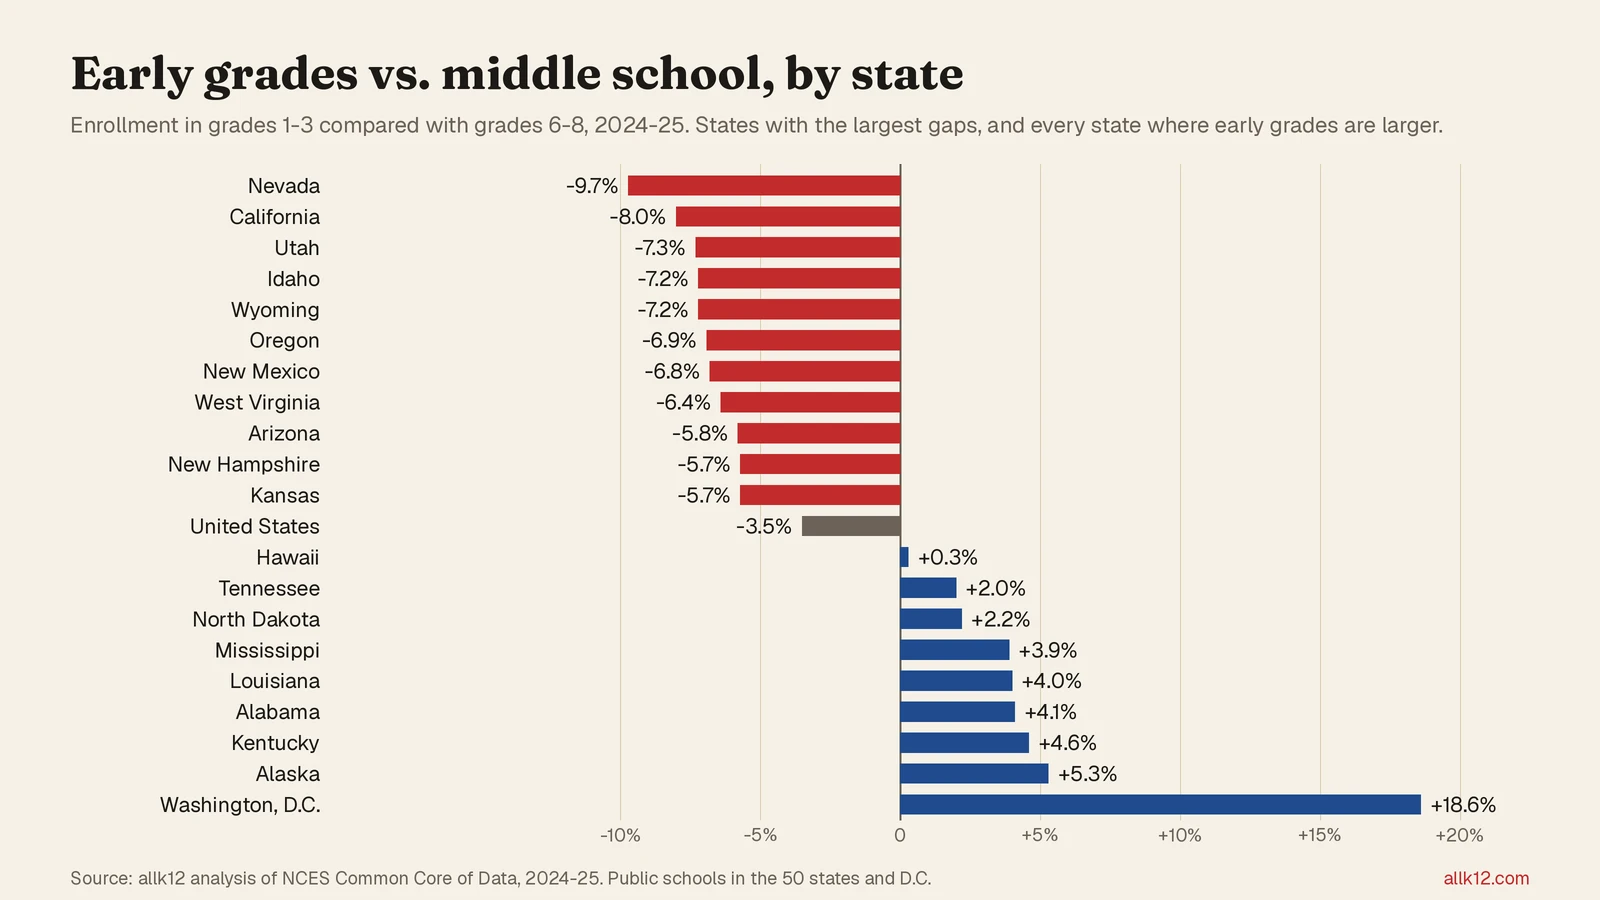
Public schools in 42 states now enroll fewer students in the early elementary grades than in middle school. In the 2024-25 school year, grades 1 through 3 were smaller than grades 6 through 8 in all but eight states, according to an allk12 analysis of federal enrollment data for every public school in the country.
Nationally, the gap is 386,578 students. Public schools enrolled 10,579,891 students in grades 1 through 3 and 10,966,469 in grades 6 through 8, which makes the early grades 3.5% smaller.
Each of those smaller classes will move up a grade every year. Districts plan staffing, budgets, and buildings around how many students they expect, so a smaller group in the early grades now points to smaller middle and high school classes later.
The West has the biggest gaps
Nevada has the largest gap of any state. Its grades 1 through 3 are 9.7% smaller than its grades 6 through 8. California follows at 8.0%, then Utah at 7.3%, Idaho and Wyoming at 7.2%, Oregon at 6.9%, and New Mexico at 6.8%. All seven are in the West.
In California, the difference is 105,234 students: 1,205,925 in grades 1 through 3, compared with 1,311,159 in grades 6 through 8. In Texas, which has the second-largest enrollment, the gap is 3.9%, or 48,194 students.
Where the early grades are bigger
Eight states and Washington, D.C., have more students in grades 1 through 3 than in grades 6 through 8: Hawaii, Tennessee, North Dakota, Mississippi, Louisiana, Alabama, Kentucky, and Alaska. Five of them are in the South. The difference is small in most, from 0.3% in Hawaii to 5.3% in Alaska.
Washington, D.C., is the outlier, with 18.6% more students in grades 1 through 3. The city's public schools, about half of them charters, enroll more young children than older ones.
Early grades vs. middle school in every state
| Rank | State | Grades 1-3 | Grades 6-8 | Difference |
|---|---|---|---|---|
| 1 | Nevada | 99,399 | 110,032 | -9.7% |
| 2 | California | 1,205,925 | 1,311,159 | -8.0% |
| 3 | Utah | 146,028 | 157,605 | -7.3% |
| 4 | Idaho | 68,538 | 73,860 | -7.2% |
| 5 | Wyoming | 19,499 | 21,018 | -7.2% |
| 6 | Oregon | 117,444 | 126,128 | -6.9% |
| 7 | New Mexico | 64,801 | 69,522 | -6.8% |
| 8 | West Virginia | 50,618 | 54,091 | -6.4% |
| 9 | Arizona | 237,695 | 252,230 | -5.8% |
| 10 | New Hampshire | 35,119 | 37,260 | -5.7% |
| 11 | Kansas | 99,733 | 105,762 | -5.7% |
| 12 | Wisconsin | 163,298 | 172,986 | -5.6% |
| 13 | New Jersey | 286,665 | 300,802 | -4.7% |
| 14 | Pennsylvania | 367,916 | 386,122 | -4.7% |
| 15 | Delaware | 31,060 | 32,501 | -4.4% |
| 16 | Georgia | 378,115 | 393,835 | -4.0% |
| 17 | Texas | 1,175,307 | 1,223,501 | -3.9% |
| 18 | Colorado | 182,428 | 189,859 | -3.9% |
| 19 | Connecticut | 106,666 | 111,008 | -3.9% |
| 20 | Washington | 235,999 | 245,285 | -3.8% |
| 21 | Illinois | 388,173 | 403,167 | -3.7% |
| 22 | New York | 535,170 | 554,651 | -3.5% |
| 23 | South Carolina | 173,394 | 179,640 | -3.5% |
| 24 | Maine | 36,353 | 37,599 | -3.3% |
| 25 | Massachusetts | 196,970 | 203,487 | -3.2% |
| 26 | Minnesota | 186,835 | 192,638 | -3.0% |
| 27 | Vermont | 16,150 | 16,629 | -2.9% |
| 28 | Iowa | 104,472 | 107,168 | -2.5% |
| 29 | Montana | 33,109 | 33,965 | -2.5% |
| 30 | Missouri | 190,482 | 195,158 | -2.4% |
| 31 | Michigan | 303,309 | 310,432 | -2.3% |
| 32 | Virginia | 274,962 | 281,461 | -2.3% |
| 33 | Indiana | 226,429 | 231,623 | -2.2% |
| 34 | Rhode Island | 29,236 | 29,896 | -2.2% |
| 35 | Florida | 631,086 | 644,878 | -2.1% |
| 36 | Nebraska | 69,768 | 71,286 | -2.1% |
| 37 | Arkansas | 107,357 | 109,559 | -2.0% |
| 38 | Ohio | 361,821 | 369,383 | -2.0% |
| 39 | Maryland | 193,470 | 197,074 | -1.8% |
| 40 | Oklahoma | 150,151 | 152,205 | -1.3% |
| 41 | North Carolina | 347,197 | 350,823 | -1.0% |
| 42 | South Dakota | 32,915 | 33,038 | -0.4% |
| 43 | Hawaii | 38,902 | 38,783 | +0.3% |
| 44 | Tennessee | 228,071 | 223,651 | +2.0% |
| 45 | North Dakota | 28,483 | 27,866 | +2.2% |
| 46 | Mississippi | 100,563 | 96,803 | +3.9% |
| 47 | Louisiana | 152,220 | 146,414 | +4.0% |
| 48 | Alabama | 172,867 | 166,123 | +4.1% |
| 49 | Kentucky | 147,792 | 141,320 | +4.6% |
| 50 | Alaska | 28,867 | 27,421 | +5.3% |
| 51 | Washington, D.C. | 21,064 | 17,762 | +18.6% |
Public school enrollment in grades 1-3 compared with grades 6-8, 2024-25. Negative numbers mean the early grades are smaller. Source: allk12 analysis of NCES Common Core of Data.
How we did this
allk12 added up enrollment by grade for every public school in the 50 states and Washington, D.C., using the National Center for Education Statistics' 2024-25 school directory, the most recent year available. We compared grades 1 through 3 with grades 6 through 8 because nearly all children attend those grades and both come before high school, when some students leave school or repeat ninth grade. Kindergarten is left out because states treat it differently.
This is a snapshot of one school year, not a count of the same children over time. Several things can make one set of grades bigger than another, including the number of children born in each year, families moving in or out of a state, students switching to private schools or home schooling, and students repeating a grade. The data does not show which of these matters most in a given state.
For total enrollment in each state, see our list of public school students by state, and for how enrollment has changed over time, see public school enrollment change by state.
Sources
Enrollment by grade from allk12's analysis of National Center for Education Statistics (NCES) Common Core of Data, 2024-25. Chart: allk12.