
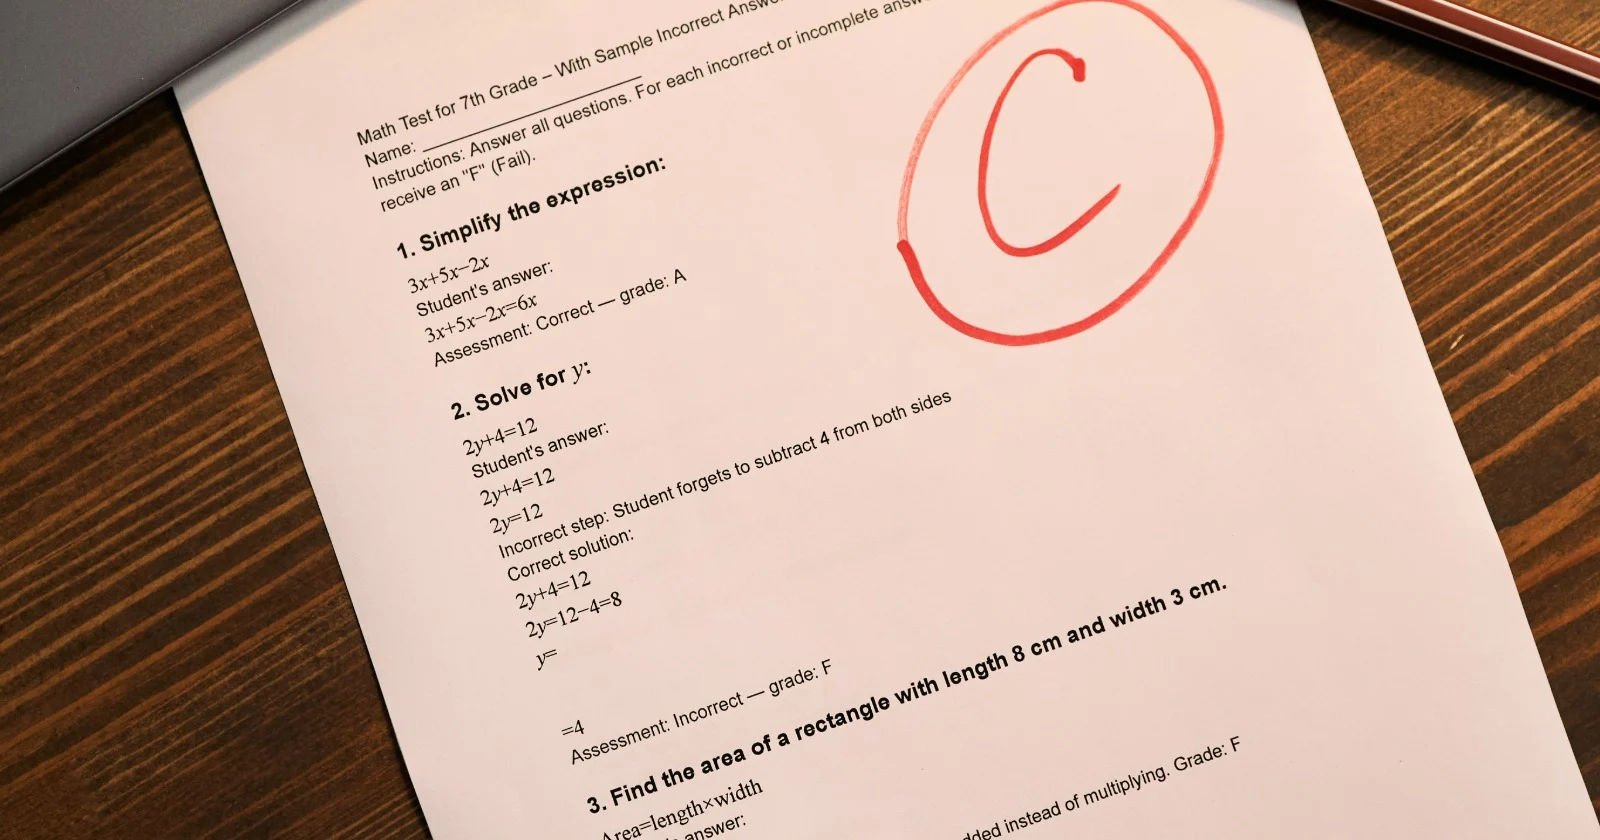
Every fall, a state test report lands in backpacks and inboxes, and a lot of parents feel a small jolt of anxiety they are not sure is warranted. The reports are dense, the labels are vague, and the cover letter rarely explains what any of it means in plain language. The good news is that once you understand a few things about how these tests work, the report becomes far less alarming and far more useful. Here is how to read it without spiraling.
What the Score Actually Measures
A state test measures how your child performed on a specific set of grade-level standards, on one particular day, under test conditions. That last part matters more than people think. A child who slept badly, felt anxious, or simply had an off morning can score below their true ability, and a child who guessed well can score above it. Every standardized test has a margin of error built in, which is exactly why no responsible educator treats a single score as the final word on a student.
The headline result is usually a performance level, with a label like below basic, approaching, proficient, or advanced. Those labels come from cut scores, the points a state decides separate one level from the next. The crucial thing to understand is that proficient is not the same as a passing grade and not the same as percentage correct. It is a bar the state set, and states set their bars at very different heights. A score that reads proficient in one state might read approaching in a tougher neighboring state on a similar body of knowledge. We dig into how wide that variation runs in our look at which state ranks number one in education.
Proficiency Tells You Less Than You Think
Proficiency levels are blunt. They sort every child into three or four buckets, which means a student near the top of the proficient band and a student barely into it get the same label, even though their performances differ a lot. The buckets also hide movement. A child who jumped 30 points but stayed inside the same band looks identical on the label to a child who did not move at all.
This is why you should read the scaled score, the underlying number, when the report provides it, and not just the label. The scaled score lets you see year-over-year movement that the proficiency band conceals. As Understood.org explains in its guide for parents, the level label is a summary, and the more detailed numbers underneath tell the fuller story of where a child stands and which direction they are heading.
Achievement Versus Growth
The single most useful distinction on these reports, and the one schools explain worst, is the difference between achievement and growth. Achievement is the proficiency level: where your child stands against the grade-level bar right now. Growth is how much your child improved over the year compared with students who started at a similar place. Many states now report both, sometimes the growth measure is called a growth percentile.
These two numbers can point in opposite directions, and that is the whole reason both exist. A child can sit below proficient yet post very high growth, which means they came in behind but are catching up fast, a genuinely encouraging picture. Another child can be comfortably proficient yet show low growth, meaning they are coasting and may not be challenged. As the testing nonprofit NWEA describes it, growth is often the truer signal of whether a school is moving a particular child forward, because it accounts for where the child began. If you only look at the proficiency label, you miss this entirely.
School Average Versus Your Child
The report usually shows your child's result next to the school, district, and state averages. Those comparisons are helpful for context, but keep them in their place. The school average reflects the whole student population, including its poverty level and the mix of students it serves, which is shaped by factors that have nothing to do with your individual child's progress. A strong school average is reassuring, and a weak one is worth asking about, but neither overrides what your own child's scores and growth are telling you.
If you want to see how your child's school compares against others on test results over multiple years, every school profile on allk12 includes a scores page with the multi-year history laid out by subject, and our state test proficiency rankings show where each state's results sit nationally. Reading your child's number against that backdrop beats reacting to it in a vacuum.
What to Actually Do With the Report
Start by resisting the urge to react to one number. Pull last year's report if you have it and look for a trend. Compare across subjects, because a child strong in reading but weak in math is telling you something specific and actionable, not signaling a general problem. Then set the test next to the evidence you already trust: report-card grades, homework, and what the teacher tells you in conferences. When all of those point the same direction, the test is confirming what you know. When the test contradicts them, the test is usually the outlier, given its margin of error.
If a low score does line up with other warning signs, that is your cue to act, not panic. Email the teacher and ask three concrete questions: which specific skills the score flags, whether the school sees the same gap day to day, and what support is available. If you suspect something deeper than a rough test day, our guides on spotting a possible learning disability and the difference between a 504 plan and an IEP walk through the next steps. A test score is a starting point for a conversation. It was never meant to be a verdict.
Sources
Understood.org: Understanding Your Child's Test Scores
NWEA: What Is Student Growth and Why Does It Matter?
National Center for Education Statistics: The Nation's Report Card (NAEP)
Edutopia: What Parents Should Know About Standardized Test Scores