
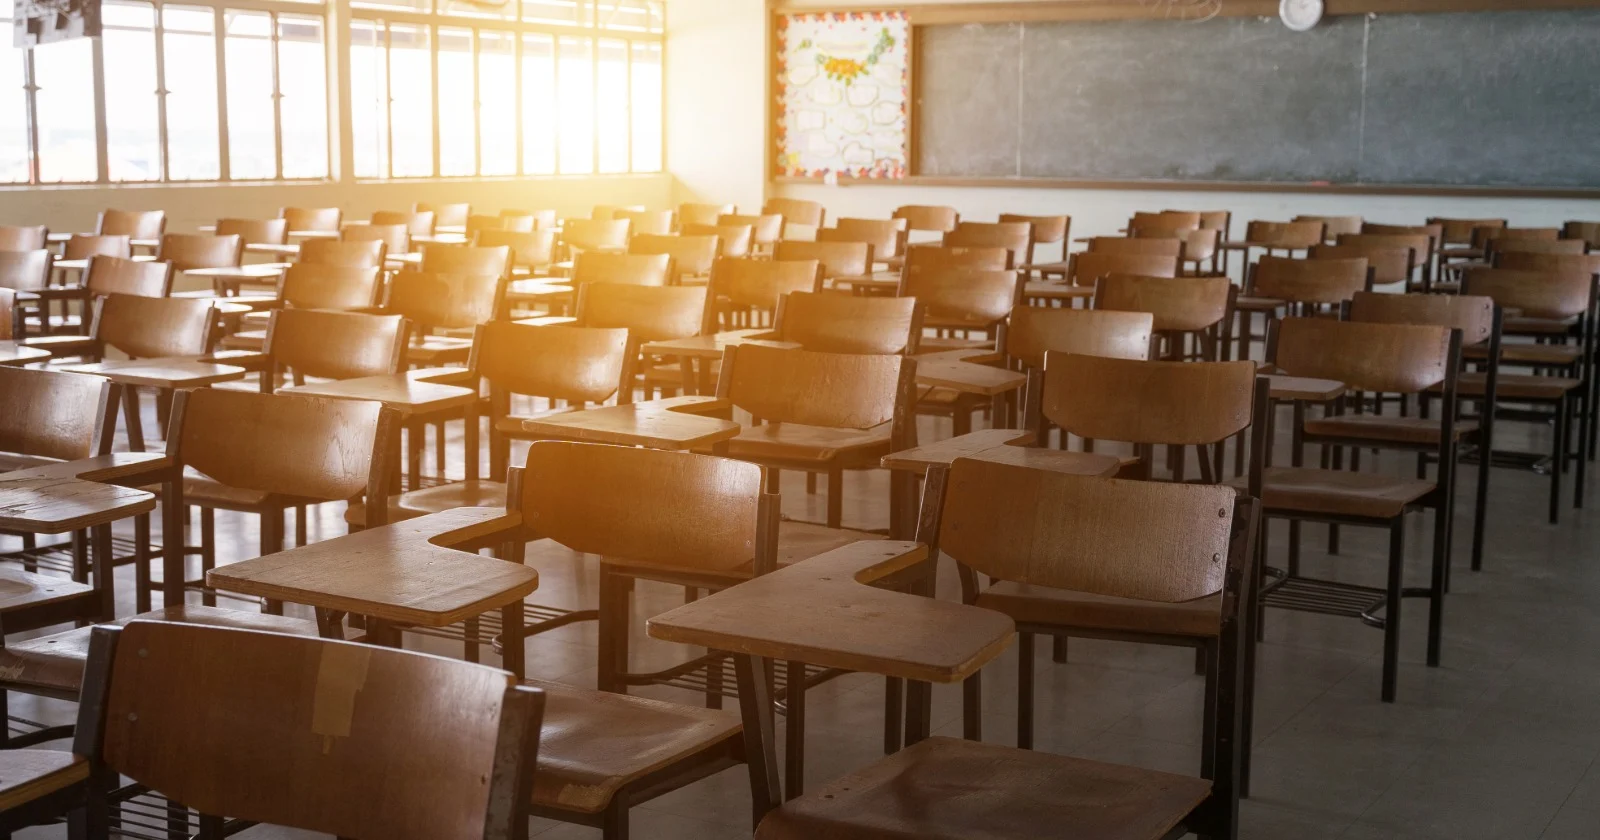
Walk the kindergarten wing of a large Los Angeles elementary school and you may pass a classroom or two with the lights off and paper taped over the door glass. The teachers who once worked those rooms were reassigned or let go. The children who filled them were never born, or were born somewhere else. That single dark hallway is what a district-wide enrollment decline looks like up close, one room at a time.
An allk12 analysis of federal enrollment records puts a number on the pattern. Between the 2017-18 and 2024-25 school years, California's Baldwin Park Unified lost 44.2 percent of its students, the steepest fall of any US district that enrolled at least 15,000 children in 2017-18. Los Angeles Unified, the nation's second-largest system, shed more than 210,000 students over the same seven years, better than a third of its enrollment. The figures come from the National Center for Education Statistics (NCES) and its Common Core of Data, the federal census of every public school.
| District | State | 2017-18 | 2024-25 | % change |
|---|---|---|---|---|
| Baldwin Park Unified | CA | 16,625 | 9,272 | -44.2% |
| Los Angeles Unified | CA | 618,864 | 406,717 | -34.3% |
| Oakland Unified | CA | 50,090 | 33,736 | -32.6% |
| Santa Ana Unified | CA | 53,109 | 35,993 | -32.2% |
| NYC Geographic District #12 (Bronx) | NY | 22,355 | 15,603 | -30.2% |
| NYC Geographic District #9 (Bronx) | NY | 33,521 | 23,687 | -29.3% |
| Compton Unified | CA | 23,017 | 16,304 | -29.2% |
| Montebello Unified | CA | 26,479 | 19,149 | -27.7% |
| East Side Union High | CA | 27,208 | 19,736 | -27.5% |
| Oceanside Unified | CA | 20,443 | 14,866 | -27.3% |
| NYC Geographic District #7 (Bronx) | NY | 18,732 | 13,625 | -27.3% |
| Vista Unified | CA | 24,690 | 18,096 | -26.7% |
| Chula Vista Elementary | CA | 30,112 | 22,235 | -26.2% |
| Escondido Union | CA | 18,695 | 13,920 | -25.5% |
Fourteen Districts, and Almost All of Them Face the Pacific
The list is not spread evenly across the country. Thirteen of the fourteen largest-shrinking districts sit in California, and they cluster into three metros. Greater Los Angeles supplies the most entries: Los Angeles Unified itself, plus Baldwin Park, Compton, and Montebello Unified in the surrounding communities. The San Francisco Bay Area contributes Oakland Unified and East Side Union High, the large high-school district on the east side of San Jose. San Diego County accounts for four of the fourteen on its own, running down the coast and inland: Oceanside, Vista, Chula Vista Elementary, and Escondido Union. Santa Ana Unified, in Orange County, rounds out the California entries.
The size range on the list is worth pausing on. We set the floor at 15,000 students in 2017-18 so the ranking measures established systems rather than small districts where a single closed school swings the percentage. Even so, the entries run from Baldwin Park, which started at 16,625 students, to Los Angeles Unified at 618,864. A 44 percent drop and a 34 percent drop describe very different absolute losses. Baldwin Park is down about 7,400 children; Los Angeles is down more than 210,000, a figure larger than the entire enrollment of most states' biggest districts. The percentage sorts them together, but the human scale of the Los Angeles decline stands alone.
The concentration is not an accident of where big districts happen to be. Coastal California combines several of the pressures that empty a classroom at the same time and in the same places.
Why the Students Left
The first and largest force is demographic, and it predates any policy debate. The US birth rate has been falling since the 2007 peak, and sociologist Kenneth Johnson (2023) has documented how that decline works its way through the school system on a delay of five to six years, as smaller birth cohorts reach kindergarten. A district does not need any family to move away to shrink under this pressure. It only needs each incoming class to be smaller than the one graduating out. California's birth totals have fallen faster than the national average, so its kindergartens felt the squeeze early.
Cost layers on top of the birth trend. The metros on this list are among the most expensive places in the country to raise a child, and families with young children are exactly the households most sensitive to housing cost. When a two-bedroom apartment near a Bay Area or coastal Southern California school runs past what a young family can carry, some of those families leave for the Inland Empire, for Texas, for Arizona. They take their kindergartners with them. Researchers who study the pandemic-era enrollment drop, including Thomas Dee (2023), found that public-school losses were largest in higher-cost urban districts, which fits the geography here closely.
The third force is where the children who stay end up enrolling. California has a large charter sector and a substantial private and homeschool population, and every student who chooses one of those options is subtracted from the traditional district's count even if the family never leaves the neighborhood. Untangling how much of each district's decline is birth rate, how much is out-migration, and how much is a shift to charters and private options is genuinely hard, and the federal enrollment file does not answer it directly. The honest reading is that all three are pulling in the same direction at once, which is why the declines here are so steep.
The Bronx Entries Are a Feature of the Data, Not a Different Story
Three names on the list break the California pattern, and they need a note. The NYC Geographic District #12, #9, and #7 entries are not conventional school districts. They are geographic community districts inside New York City, the units the federal data uses because it splits the single New York City system into its component community districts rather than reporting one giant number. All three sit in the Bronx, and all three lost more than a quarter of their enrollment between 2017-18 and 2024-25. New York City as a whole has been losing students to the same mix of falling births, high housing cost, and out-migration that drives the California list, and the Bronx districts show that pressure at the community-district scale the data happens to expose.
Puerto Rico Fell Further, but Sits Outside the Ranking
One system outpaced every district above and does not appear in the table. Puerto Rico's public schools lost roughly 31.9 percent of their enrollment across the same period, a territory-wide collapse driven by out-migration to the mainland after Hurricane Maria and a birth rate that has fallen even faster than California's. Because Puerto Rico is a territory rather than a state and its department of education operates as a single island-wide system, it is not comparable to the state-based districts ranked here, so we hold it out and note it separately.
The Flip Side of the School-Closure Story
These numbers do not sit on their own. A district that loses a quarter or a third of its students over seven years cannot keep every building open, and the districts near the top of this list are the same ones that have spent recent years debating and voting on school closures and consolidations. Enrollment decline is the upstream cause; the closure map is the downstream effect. Oakland, San Francisco's neighbor across the bay, and Los Angeles have all run public processes to shutter or merge under-enrolled schools, and every one of those decisions traces back to a version of the dark kindergarten hallway.
That connection matters because the two stories are often told separately. A closure vote lands as a local political fight over one building and one neighborhood, and it is easy to read it as a failure of that particular school. Seen against the enrollment trend, most closures are arithmetic catching up. A district built for a student body that no longer exists carries fixed costs, staffing minimums, and half-empty rooms, and at some point the budget forces a choice between spreading a shrinking pot of per-pupil money across too many schools or consolidating into fewer, fuller ones. The districts at the top of this list reached that point first because their enrollment fell furthest.
For families reading this in one of the fourteen districts, the practical takeaway is narrower than the headline. A shrinking district is not automatically a failing one. Smaller cohorts can mean smaller classes and more space per child, at least until the budget math forces cuts, because most district funding follows enrollment. The questions worth asking your own district are concrete ones: which schools are on a consolidation list, how per-pupil spending is holding up as the count falls, and whether the school your child attends is one the district plans to keep. The enrollment trend sets the terms. It does not decide, by itself, what your school will be.
Sources
allk12 analysis of National Center for Education Statistics (NCES) enrollment data, school years 2017-18 and 2024-25.
NCES, Common Core of Data