Northwest Independent School District in North Texas owed $2.28 billion in long-term debt at the end of fiscal 2024, or $74,188 for each of its 30,736 students. That was the highest debt per student among the 271 U.S. school districts with at least 25,000 students, according to allk12's analysis of the U.S. Census Bureau's Annual Survey of School System Finances, released in May 2026.
The median large district owed $8,772 per student. Northwest's figure is about 8.5 times that ($74,188 ÷ $8,772 = 8.46). Sixteen large districts reported no long-term debt at all, and they are counted in the median. Leaving them out raises it to $9,107.
Texas districts stand out. They make up 51 of the 271 large districts but 13 of the top 20. The median Texas district in the group owed $23,901 per student, compared with $7,693 for large districts in all other states combined. The other seven spots went to California (three), Colorado (two), South Carolina, and Washington.
An earlier allk12 story on financial red flags at the largest districts drew on a Reason Foundation scorecard that used eight measures from districts' audited annual reports, including total liabilities per student. The Census measure is narrower. It counts long-term debt, which the bureau defines as debt payable more than one year after it is issued, and it leaves out retirement benefits and leases.
Large districts with the most debt per student
The table divides long-term debt at the end of fiscal 2024 by fall 2023 enrollment. Interest is what each district paid that year. Current spending per student is the Census Bureau's figure for day-to-day costs such as salaries, benefits, and supplies, without construction or debt payments.
| Rank | District | State | Enrollment (fall 2023) | Long-term debt ($ millions) | Debt per student | Interest paid ($ millions) | Current spending per student |
|---|---|---|---|---|---|---|---|
| 1 | Northwest ISD | Texas | 30,736 | 2,280.2 | $74,188 | 74.7 | $10,825 |
| 2 | Lamar CISD | Texas | 44,512 | 3,112.2 | $69,918 | 121.3 | $11,147 |
| 3 | Prosper ISD | Texas | 28,467 | 1,937.5 | $68,061 | 72.0 | $11,249 |
| 4 | San Diego Unified | California | 95,492 | 6,332.2 | $66,311 | 197.5 | $21,281 |
| 5 | Denton ISD | Texas | 32,866 | 2,104.6 | $64,035 | 88.9 | $11,854 |
| 6 | West Contra Costa Unified | California | 25,575 | 1,346.0 | $52,631 | 47.3 | $21,597 |
| 7 | Comal ISD | Texas | 29,263 | 1,027.8 | $35,121 | 41.5 | $10,374 |
| 8 | Midland ISD | Texas | 28,752 | 985.7 | $34,283 | 4.9 | $12,465 |
| 9 | Austin ISD | Texas | 72,830 | 2,466.0 | $33,860 | 85.4 | $14,133 |
| 10 | Oakland Unified | California | 33,916 | 1,148.0 | $33,847 | 46.9 | $25,692 |
| 11 | Spring Branch ISD | Texas | 33,407 | 1,118.0 | $33,467 | 50.7 | $12,654 |
| 12 | Frisco ISD | Texas | 66,698 | 2,192.0 | $32,864 | 91.4 | $10,604 |
| 13 | Lexington County School District 1 | South Carolina | 27,105 | 865.8 | $31,942 | 20.8 | $15,085 |
| 14 | Denver Public Schools | Colorado | 88,258 | 2,815.8 | $31,904 | 142.5 | $17,972 |
| 15 | Tacoma School District | Washington | 28,272 | 885.3 | $31,312 | 28.9 | $19,619 |
| 16 | Boulder Valley School District | Colorado | 28,357 | 881.4 | $31,082 | 43.7 | $17,771 |
| 17 | Alvin ISD | Texas | 29,740 | 918.0 | $30,869 | 37.4 | $11,435 |
| 18 | San Antonio ISD | Texas | 44,670 | 1,376.4 | $30,813 | 62.9 | $15,140 |
| 19 | Lewisville ISD | Texas | 48,440 | 1,490.3 | $30,766 | 43.2 | $13,147 |
| 20 | Leander ISD | Texas | 42,593 | 1,308.7 | $30,726 | 89.9 | $10,850 |
| Median, 271 large districts | $8,772 | $14,658 |
Source: U.S. Census Bureau, 2024 Annual Survey of School System Finances, summary file elsec24t.txt (released May 2026). Includes districts with fall 2023 enrollment of at least 25,000. Debt is long-term debt outstanding at the end of fiscal 2024. The Census Bureau imputed Lexington County School District 1's debt figure. Colorado figures exclude debt of charter schools. Rankings and medians from allk12's analysis of the file.
Each rate is simple division. Northwest ISD reported $2,280,248,000 in debt and 30,736 students: $2,280,248,000 ÷ 30,736 = $74,188. Lamar Consolidated ISD reported $3,112,195,000 for 44,512 students, or $69,918 each. San Diego Unified, the largest district in the top 20, reported $6,332,199,000 for 95,492 students, or $66,311 each.
Borrowing also carries a yearly bill. Northwest ISD paid $74.7 million in interest in fiscal 2024, or $2,429 per student, more than seven times the large-district median of $336. That interest equaled about 22% of the district's $332.7 million in current spending that year ($74.7 million ÷ $332.7 million = 0.22). Together, the 20 districts in the table owed $36.59 billion and paid $1.39 billion in interest.
Twelve of the 13 Texas districts in the table spent less per student on daily operations than the large-district median of $14,658. San Antonio ISD, at $15,140, was the exception. Some also spent heavily on construction and equipment. Prosper ISD's capital outlay reached $429.6 million in fiscal 2024, or $15,090 per student, compared with a large-district median of $1,963.
The biggest city districts ranked lower. Chicago ranked 23rd at $29,256 per student, Los Angeles 26th at $29,128, and New York City 62nd at $18,657. Fort Bend ISD, which topped the Reason Foundation's red-flag list, ranked 53rd at $20,824. Georgia's Gwinnett County ranked 181st at $6,049.
What drives school district debt
In Texas, most school debt is approved at the ballot box. According to the Texas Bond Review Board, over 98% of school district debt outstanding is voter approved, and the money can pay for buildings, renovations, technology, athletic facilities, school transportation, and performing arts. State law limits payments on that debt to a maximum of 50 cents per $100 of property value, a rule known as the 50-cent test.
The board reported that Texas school districts owed $148.38 billion as of August 31, 2025, or 40.2% of all local government debt in the state. Their tax-supported debt, backed by local property taxes, grew from $97.57 billion in 2021 to $148.27 billion in 2025, a 52% increase ($148.27 billion ÷ $97.57 billion = 1.52). In the state's 2025 fiscal year, voters approved an estimated $14.85 billion of the $23.56 billion in school bonds put before them.
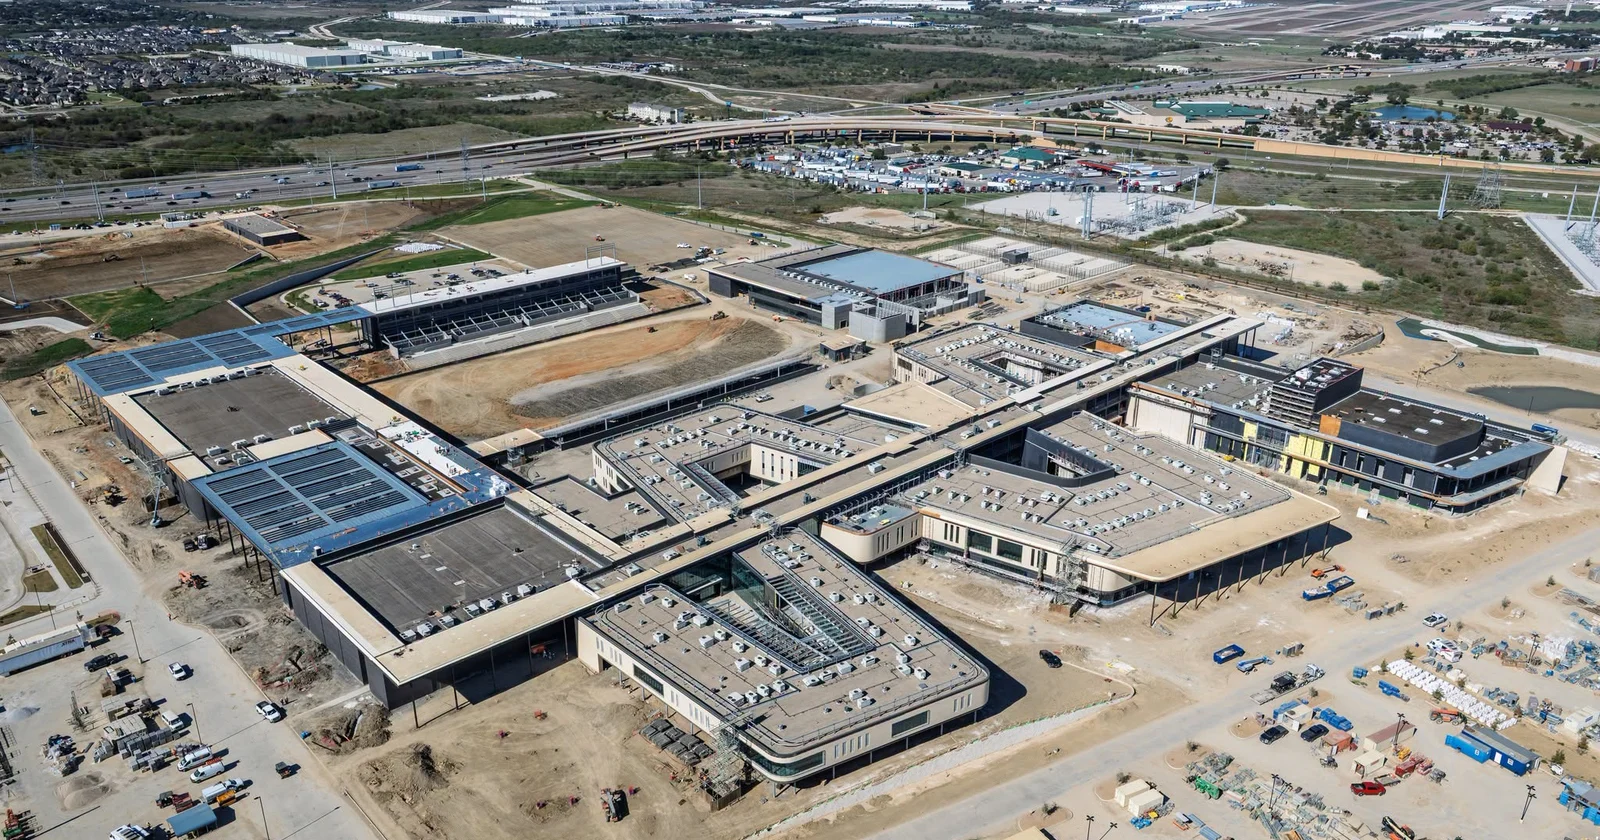
Two of the top three districts tie their borrowing to enrollment growth. Northwest ISD voters approved a $1.995 billion bond package in May 2023 to build 12 new schools. Superintendent Mark Foust said "we regularly build new schools and facilities to keep pace with growth." The Census file shows the district issued $542.9 million in new long-term debt during fiscal 2024.
Lamar CISD, which says it serves nearly 49,000 students, went back to voters after the period covered here. On November 4, 2025, voters approved $1,958,310,000 in bonds, according to the district's preliminary results, for a package the district said was designed mainly to fund new schools and improvements tied to projected enrollment growth. Prosper ISD, third on the list, says voters approved $2.7 billion in November 2023.
In California, San Diego Unified says four voter-approved bond measures pay for its building program. They include Measure YY, a $3.4 billion bond approved by 65.08% of voters in 2018, and Measure U, a $3.2 billion bond approved by 65.28% in 2022. The district lists projects such as new classrooms, safety and security upgrades, and plumbing work.
The Census figures have limits. The bureau counts debt issued in the name of an independent school district, or by a parent government for a school system it runs. It excludes debt issued by some school building authorities and cities for school construction, plus general obligation debt not issued only for schools, as in Washington, D.C., and Hawaii. Hawaii's public schools report as one statewide system with 169,308 students, and the bureau says responsibility for school construction debt there lies with the state government.
States split borrowing among districts, cities, counties, and state governments in different ways, so a low or zero figure may reflect debt carried by another government. The bureau also warns that per-student comparisons can mislead because school systems differ in accounting methods, government structure, and economics. Fiscal years differ, too. Texas and Washington districts closed fiscal 2024 on August 31, 2024, while districts in California, Colorado, and South Carolina closed on June 30, 2024.
Sources
U.S. Census Bureau: 2024 Public Elementary-Secondary Education Finance Data
U.S. Census Bureau: Annual Survey of School System Finances, fiscal 2024 summary data file
U.S. Census Bureau: 2024 Annual Survey of School System Finances technical documentation
Texas Bond Review Board: 2025 Local Government Annual Report
Northwest ISD: Northwest ISD voters approve all props in 2023 bond election
Lamar CISD: Lamar CISD Voters Approve 2025 Bond Propositions
Prosper ISD: Board Recap, June 13, 2025
San Diego Unified School District: Proposition S, Proposition Z, Measure YY, and Measure U
Rankings, medians, and per-student figures from allk12's analysis of the Census Bureau's fiscal 2024 school finance file. District profiles from allk12's analysis of National Center for Education Statistics (NCES) Common Core of Data, 2024-25.