The bulletin board for America's public schools. Parents, teachers, students, and staff. One community per school.
ENROLLMENT

Public schools have 1.4 million fewer students than before the pandemic and the same number of schools

Enrollment fell 2.8% from fall 2019 to fall 2024 while the school count held at about 95,400. Nearly one in four schools is at least 15% smaller, and 3,386 closed.

November 9, 2026
Public schools have 1.4 million fewer students than before the pandemic and the same number of schools
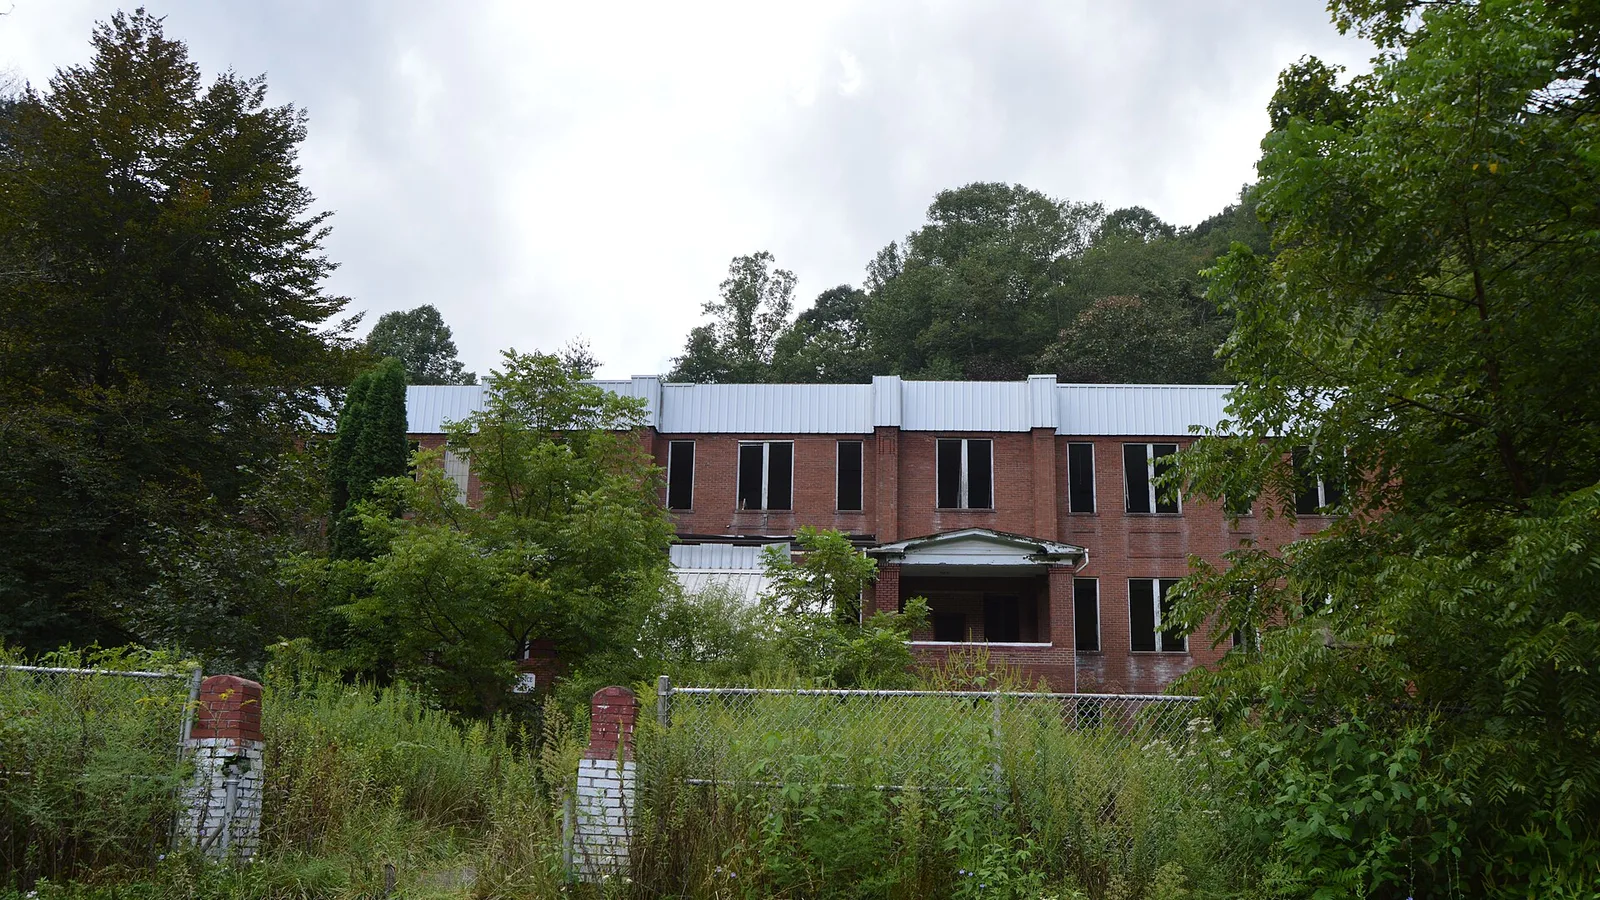
Image Credit: Nyttend, public domain, via Wikimedia Commons
KEY FINDING
Federal data shows 1,419,064 fewer public school students in fall 2024 than in fall 2019, and 65 more operating schools. Closures were more common at small schools, charter schools, and schools serving more low-income or Black students.
Fewer students
1,419,064
-2.8% since fall 2019
Change in schools
+65
95,397 to 95,462
At least 15% smaller
23.0%
16,051 of 69,725 schools
Schools closed
3,386
3.5% of fall 2019 schools
ENROLLMENT, SCHOOLS, AND CLOSURES BY STATE · FALL 2019 → FALL 2024
StateStudents ↑Net schools15%+ smallerClosed% closedTeachers
West Virginia-8.1%-434.3%304.6%-3.0%
New Mexico-8.0%-1140.2%141.6%+6.3%
Hawaii-7.7%329.9%00.0%-1.3%
Mississippi-7.5%-3028.1%586.5%—
New Hampshire-7.4%525.7%204.0%-1.3%
Vermont-6.7%-418.0%82.7%+2.2%
Louisiana-6.1%-4331.9%936.9%—
Oregon-6.1%2934.0%342.7%+0.9%
New York-5.8%-326.4%931.9%—
California-5.8%-6328.2%2532.5%—
Wisconsin-5.7%-7222.8%1225.5%+0.4%
Rhode Island-5.6%-415.5%154.9%+0.7%
Michigan-5.4%-9021.2%1544.5%+2.1%
Colorado-5.2%-1732.5%1146.0%-1.5%
Nevada-5.2%1238.1%40.6%—
Kentucky-5.2%-621.4%473.3%+0.9%
Maine-5.1%-516.8%234.1%+1.3%
Illinois-5.1%-44419.4%972.3%+4.1%
Wyoming-5.0%-1922.3%133.6%+1.1%
Washington-4.2%6725.7%582.4%-4.8%
Connecticut-3.9%-615.7%303.0%-0.3%
Arizona-3.9%8636.3%241.2%-1.5%
Massachusetts-3.4%-2315.6%744.0%+3.8%
Virginia-3.1%-417.9%361.9%+3.1%
Alaska-3.1%-1435.7%163.2%-6.5%
Kansas-3.1%2717.6%393.0%+2.1%
Pennsylvania-2.6%3617.9%722.5%+4.1%
Iowa-2.3%518.7%544.1%+0.4%
Missouri-2.2%5520.2%522.3%+4.1%
Maryland-2.0%-1518.5%312.2%+1.2%
Minnesota-1.8%10018.1%1898.1%+3.6%
Ohio-1.6%6719.3%1795.2%-3.4%
Georgia-1.4%2218.4%602.6%+4.0%
New Jersey-1.4%-2811.3%763.0%+1.0%
Indiana-1.3%515.5%774.1%—
Tennessee-1.2%3516.1%945.2%—
Arkansas-1.1%2016.6%595.6%—
Montana-1.0%1412.9%121.5%-1.2%
Oklahoma-0.8%-1120.2%693.9%-1.7%
North Carolina-0.7%3520.1%742.8%-5.6%
Florida-0.1%-1526.5%1884.7%—
Utah0.0%2328.7%353.4%+1.9%
Nebraska+0.1%1415.5%282.8%-2.8%
South Dakota+0.8%-712.6%314.5%+1.3%
Alabama+0.9%3615.1%191.4%+0.2%
Texas+0.9%21627.0%4164.7%-1.5%
South Carolina+1.3%621.8%544.4%+4.5%
Idaho+1.4%4023.6%202.7%+1.3%
Delaware+1.6%820.9%10.5%-3.9%
North Dakota+3.1%2217.4%193.9%—
District of Columbia+5.0%1522.2%83.5%—
51 of 51 rows · "15%+ smaller" covers regular, non-virtual schools with at least 100 students in fall 2019 that offered the same grades in both years. "Teachers" compares 62,764 schools that reported teachers in both years (2,133,697 to 2,146,177 teachers, or 15.5 to 14.8 students per teacher) and is blank where the counts aren't comparable. Illinois shows a large drop in schools because 392 small programs reported enrollment in fall 2019 and not afterward.↓ Download school-closures-since-the-pandemic.csv
NATIONAL TOTALS BY YEAR
School year ↑Operating schoolsStudentsStudents per school
Fall 201995,39750,453,111529
Fall 202095,09149,062,400516
Fall 202195,86249,112,933512
Fall 202295,89149,313,892514
Fall 202395,74649,211,615514
Fall 202495,46249,034,047514
6 of 6 rows
WHICH SCHOOLS CLOSED
MeasureGroupSchools in fall 2019Closed% closed
School typeTraditional district school83,9652,6743.2%
School typeCharter school7,4895847.8%
Students from low-income familiesLowest quarter in its state21,4053921.8%
Students from low-income familiesSecond quarter21,3894382.0%
Students from low-income familiesThird quarter21,3788123.8%
Students from low-income familiesHighest quarter in its state21,3721,1665.5%
Black studentsUnder 10%62,3441,8423.0%
Black students10% to 49%23,9178323.5%
Black students50% or more9,1367127.8%
Enrollment in fall 2019500 or more students39,9333841.0%
Enrollment in fall 2019200 to 499 students37,6771,4003.7%
Enrollment in fall 2019Under 200 students17,7871,6029.0%
12 of 12 rows · Low-income quarters are set within each state and leave out the District of Columbia, Delaware, Massachusetts, Ohio, and Tennessee, which report free and reduced-price lunch for too few schools. The school type rows leave out schools with no charter status on file.

US public schools enrolled 1,419,064 fewer students in fall 2024 than in fall 2019, a 2.8% drop, and the country had 65 more operating schools, according to an allk12 analysis of federal data.

Enrollment fell from 50,453,111 to 49,034,047 students, and the school count went from 95,397 to 95,462. The drop wasn't spread evenly. West Virginia lost 8.1% of its students and New Mexico lost 8.0%, while Hawaii, Mississippi, and New Hampshire each lost more than 7%. Nine states and the District of Columbia gained students, led by DC at 5.0% and North Dakota at 3.1%.

With about the same number of schools and fewer students, the average school went from 529 students to 514. Nearly all of that happened in the first year of the pandemic, when the average fell to 516, and it has stayed between 512 and 514 since.

Nearly one in four schools is well below its pre-pandemic size. Among 69,725 regular schools that offered the same grades in both years and had at least 100 students in fall 2019, 16,051, or 23.0%, had lost at least 15% of their students by fall 2024, and 2,703 of those had lost 30% or more. The typical school was down 5.9%, while 21,693 schools (31.1%) grew. New Mexico had the highest share of schools down 15% or more at 40.2%, followed by Nevada at 38.1% and Arizona at 36.3%, and New Jersey had the lowest at 11.3%.

The number of teachers went up over the same period. At the 62,764 schools that reported teachers in both years, teachers rose 0.6%, from 2,133,697 to 2,146,177 on a full-time basis, and that brought the average down from 15.5 students per teacher to 14.8, a 4.5% drop. The teacher staffing report goes back to 2017.

Of the schools operating in fall 2019, 3,386 had closed by fall 2024, or 3.5%, and they'd enrolled 855,665 students in fall 2019. About 4,800 schools that weren't operating in fall 2019 were open in fall 2024.

Texas had the most closures at 416, followed by California at 253, Minnesota at 189, Florida at 188, and Ohio at 179. Minnesota also had the highest share of its schools close at 8.1%, followed by Louisiana at 6.9% and Mississippi at 6.5%. Hawaii had none.

Closures were more common at some kinds of schools than others. Charter schools, which are publicly funded but run independently of school districts, closed at a 7.8% rate, compared with 3.2% for traditional district schools. Schools with fewer than 200 students closed at 9.0%, compared with 1.0% for schools with 500 or more.

Schools serving more low-income students and more Black students also closed more often. When schools in each state are ranked by the share of students who qualified for free or reduced-price lunch, a common measure of family income, 5.5% of the highest-share quarter closed, compared with 1.8% of the lowest-share quarter. Where at least half of students were Black, 7.8% of schools closed, compared with 3.0% of schools where fewer than 10% were.

The same pattern showed up among traditional district schools alone, at 5.0% against 1.5% for the low-income groups and 6.5% against 2.8% for the Black enrollment groups. The table shows each trait one at a time and doesn't separate them, so a small school that's also high-poverty is counted in both rows.

How the numbers work

The totals cover the 50 states and DC, and they leave out U.S. territories. A school counts as operating if the federal Common Core of Data lists it as open and it reports enrollment. A school counts as closed only if the National Center for Education Statistics marked it closed after fall 2019, it wasn't operating in fall 2024, and no new ID number took over its name in the same city, since districts sometimes renumber their schools. That's a stricter test than the one in allk12's count of closures since 2017, which includes every school whose ID number disappeared, so the two totals can't be compared.

The teacher comparison leaves out California, which reported no teacher counts for fall 2019, and Arkansas, the District of Columbia, Florida, Indiana, Louisiana, Mississippi, Nevada, New York, and North Dakota, where reported counts changed in ways that look like a change in what the state reports. In Illinois, 392 small programs, most of them special education and alternative schools, reported enrollment in fall 2019 and not afterward. Without them, the country's count of schools would be up by about 460.

The newest federal data is for fall 2024, so schools that closed or were approved for closing after that aren't counted here.

Source: National Center for Education Statistics Common Core of Data, 2019-20 through 2024-25, through the Urban Institute's Education Data Portal.

HOW TO CITE THIS REPORT

Anyone is welcome to cite or republish these findings. Please credit allk12.com and link back to this page so readers can verify the underlying data.

allk12 (2026). "Public schools have 1.4 million fewer students than before the pandemic and the same number of schools." Retrieved from https://allk12.com/reports/school-closures-since-the-pandemic
Source: <a href="https://allk12.com/reports/school-closures-since-the-pandemic">allk12.com</a>
For interview requests or custom data pulls: [email protected]
DOWNLOAD THE DATA
↓ school-closures-since-the-pandemic.csv
DATA NOTICE

allk12 is independent and not affiliated with, endorsed by, or sponsored by NCES, the US Census Bureau, any state education agency or assessment program, or any other government agency. Source data is compiled from public records and provided "as is," without warranty of accuracy or completeness. You rely on it, and any analysis derived from it, at your own risk. See the full disclaimer.